Cite as: Oxman AD, Chalmers I, Dahlgren A (2022). Key Concepts for Informed Health Choices: 2.4 Descriptions of effects should reflect the risk of being misled by the play of chance. James Lind Library (www.jameslindlibrary.org).
© Andy Oxman, Centre for Epidemic Interventions Research, Norwegian Institute of Public Health, Norway. Email: oxman@online.no
This is the fourth of four essays in this series explaining key concepts about the trustworthiness of evidence from treatment comparisons. In this essay, we explain four considerations about the risk of being misled by the play of chance – be cautious of:
- small studies,
- results for a selected group of people within a study,
- p-values, and
- results reported as “statistically significant” or “non-significant”.
The basis for these concepts is described elsewhere [Oxman 2022].
Be cautious of small studies.
When there are few outcome events, differences in outcome frequencies between the treatment comparison groups may easily have occurred by chance and may mistakenly be attributed to differences in the effects of the treatments, or the lack of a difference.
For example, by 1977 there were at least four randomized trials that compared the number of deaths in patients given a beta-blocker to patients given a placebo. Beta-blockers are medicines that work by blocking the effects of epinephrine (also known as adrenaline). There was a small number of deaths in each study and the results appeared to be inconsistent, as can be seen in the figure on the left below [Antman 1992]. The results of individual studies continued to vary up until 1988. However, as can be seen on the right of Figure 1, if the results of the available studies were combined, the overall estimate (across studies) changed very little after 1977. It simply became more precise. This is indicated by the horizontal lines, which show the confidence intervals for each effect estimate.
Figure 1. Results of 17 randomized trials of the effects of oral beta-blockers for preventing deaths in patients surviving a heart attack [Antman 1992]
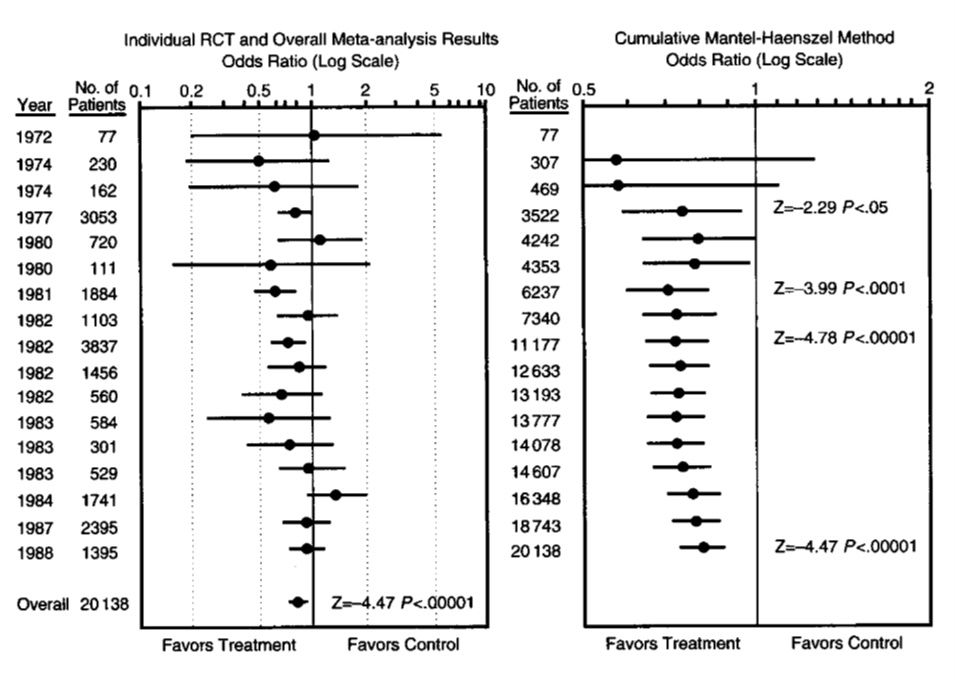
In the example above, the variation in effect estimates may have occurred largely by chance alone. The overall effect estimate across the small studies was consistent with the results of a large randomized trial with a low risk of bias published in 1986 [Egger 1997]. However, effect estimates from small studies may overestimate actual effects. There are several possible reasons for this. Compared to large studies, small studies may be more prone to publication bias and reporting bias, may have a higher risk of bias because of the design of the studies. Small studies also may include more highly selected participants and may implement treatments more uniformly.
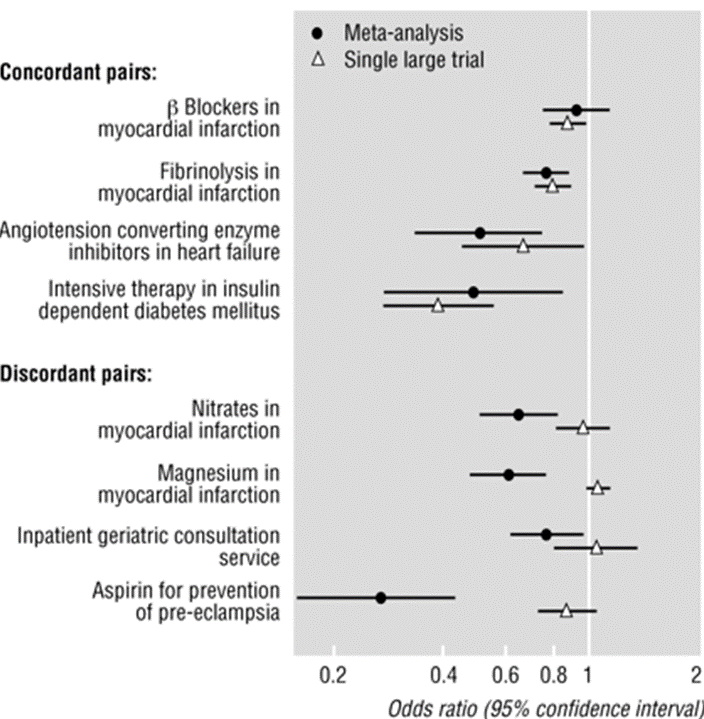
For example, in some countries, intravenous (IV) magnesium was administered to heart attack patients to limit damage to the heart muscle, prevent serious arrhythmias and reduce the risk of death. A controversy erupted in 1995, when a large well‐designed trial with 58,050 participants did not demonstrate any beneficial effect to IV magnesium, contradicting earlier meta‐analyses of the smaller trials. Figure 2 shows four examples where the results of small trials were consistent with the results of a single large trial (concordant pairs) and four examples where they were not consistent (discordant pairs), including IV magnesium for acute heart attacks [Egger 1997].
Figure 2. Results from four concordant and four discordant pairs of metaanalyses and large randomized trials
It is difficult to predict when or why effect estimates from small studies will differ from effect estimates from large studies with a low risk of bias or to be certain about the reasons for differences. However, systematic reviews should consider the risk of small studies being biased towards larger effects and consider potential reasons for bias in effect estimates from small studies. A systematic review published in 2007 included 26 randomized trials that compared IV magnesium to an inactive substance (placebo) [Li 2007]. IV magnesium reduced the incidence of serious arrhythmias, but also increased the incidence of profound hypotension, bradycardia, and flushing. The apparent large effect of magnesium on reducing the number of deaths may have reflected various biases in smaller trials.
Be cautious of results for a selected group of people within a study.
Average effects do not apply to everyone. However, comparisons of treatments often report results for selected groups of participants to assess whether the effect of a treatment is different for different types of people (e.g., men and women or different age groups). These analyses are often poorly planned and reported. Most differential effects suggested by these “subgroup” analyses are likely to be due to the play of chance and are unlikely to reflect true treatment differences.
For example, in 1983 the authors of a paper that presented 146 subgroup analyses of the Beta Blocker Heart Attack trial, found that the results were normally distributed – a pattern that would be expected if the variation in results was simply due to the play of chance [Oxman 2012]. Roughly 2.5% of the subgroup analyses had results that statistically were “significantly” worse and 2.5% had results that were “significantly” better. Five years later the International Study of Infarct Survival 2 (ISIS-2) trial found that aspirin reduced mortality after heart attack overall (P<0.00001) but increased mortality by a small amount in patients born under Gemini and Libra astrological signs. The authors included this subgroup analysis in their report to illustrate the likelihood of misleading subgroup analyses. Six years after that, the DICE (Don’t Ignore Chance Effects) collaborators in their meta-analysis of trials of DICE therapy (rolling dice) for acute stroke found that red dice are deadly, based on a predefined subgroup analysis by colour of dice. All these findings illustrate the important message that chance influences the results of treatment comparisons and systematic reviews. Unfortunately, researchers, health professionals, patients and the public continue to be misled by subgroup analyses.
Be cautious of p-values.
The observed difference in outcomes is the best estimate of how relatively effective and safe treatments are (or would be, if the comparison were made in many more people). However, because of the play of chance, the true difference may be larger or smaller than this. The confidence interval is the range within which the true difference is likely to lie, after considering the play of chance. Although a confidence interval (margin of error) is more informative than a p-value, often only the latter is reported. P-values are often misinterpreted to mean that treatments have or do not have important effects.
For example, George Siontis and John Ioannidis reviewed 51 articles that reported “statistically significant tiny effects” published in four high profile journals [Siontis 2011]. Even minimal bias in those studies could explain the observed “effects”. Yet, more than half (28) of the articles did not express any concern about the size or uncertainty of the estimate of the observed effect. Despite the low p-values reported in these articles, the results often excluded effects that would be large enough to be important. Interpretation of small effects based on p-values alone is likely to be misleading.
Be cautious of results reported as “statistically significant” or “non-significant”.
“Statistical significance” may be confused with “importance”. The cut-off for considering a result as statistically significant is arbitrary, and statistically “non-significant” results can be either informative (showing that it is very unlikely that a treatment has an important effect) or inconclusive (showing that the relative effects of the treatments compared are uncertain).
For example, two studies of a possible adverse effect of anti-inflammatory drugs (COX-2 inhibitors) on the risk of heart rhythm abnormalities (atrial fibrillation) were reported as having had “statistically nonsignificant” results [Schmidt 2014]. The authors of one of the articles concluded that exposure to the drugs was “not associated” with an increased risk and that the results stood in contrast to those from an earlier study with a “statistically significant” result. However, the effect estimates were the same for the two studies: a risk ratio of 1.2 (that is, a 20% relative increase). The earlier study was simply more precise, as indicated by the narrower confidence interval in Figure 3. Concluding that the results of the second study showed “no association” was misleading, considering that the confidence interval ranged from a 3% decrease in risk to a 48% increase. It is also misleading to conclude that the results were in contrast with the earlier study that had an identical observed effect. Yet, misleading interpretations like this, which are based on an arbitrary cut-off for “statistical significance” are common.
Figure 3. Two studies of the association between (COX-2 inhibitors) and atrial fibrillation*
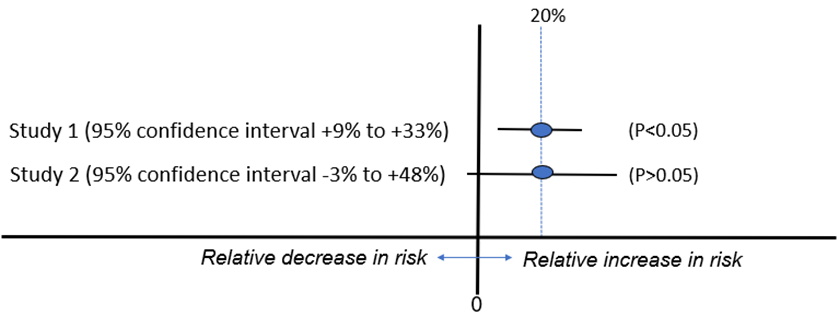
* Based on [Schmidt 2014]
Implications
- Be cautious about relying on the results of treatment comparisons with few outcome events. The results of such comparisons can be misleading.
- Findings based on results for subgroups of people within treatment comparisons may be misleading.
- Understanding a confidence interval may be necessary to understand the reliability of estimates of treatment effects. Whenever possible, consider confidence intervals when assessing estimates of treatment effects. Do not be misled by p-values.
- Claims that results were ‘significant’ or ‘non-significant’ usually mean that they were ‘statistically significant’ or ‘statistically non-significant’. This is not the same as ‘important’ or ‘not important’. Do not be misled by such claims.
This James Lind Library Essay has been republished in the Journal of the Royal Society of Medicine 2023;116:144-147. Print PDF
< Previous Essay | Next Essay >
References
Antman EM, Lau J, Kupelnick B, Mosteller F, Chalmers TC. A comparison of results of meta-analyses of randomized control trials and recommendations of clinical experts. Treatments for myocardial infarction. JAMA. 1992;268(2):240-8. https://doi.org/10.1001/jama.1992.03490020088036
Egger M, Davey Smith G, Schneider M, Minder C. Bias in meta-analysis detected by a simple, graphical test. BMJ. 1997;315(7109):629-34. https://doi.org/10.1136/bmj.315.7109.629
Li J, Zhang Q, Zhang M, Egger M. Intravenous magnesium for acute myocardial infarction. Cochrane Database Syst Rev. 2007;2007(2):Cd002755. https://doi.org/10.1002/14651858.cd002755.pub2
Oxman AD. Subgroup analyses. BMJ. 2012;344:e2022. https://doi.org/10.1136/bmj.e2022
Oxman AD, Chalmers I, Dahlgren A, Informed Health Choices Group. Key Concepts for Informed Health Choices: a framework for enabling people to think critically about health claims (Version 2022). IHC Working Paper. 2022. http://doi.org/10.5281/zenodo.6611932
Schmidt M, Rothman KJ. Mistaken inference caused by reliance on and misinterpretation of a significance test. Int J Cardiol. 2014;177(3):1089-90. https://doi.org/10.1016/j.ijcard.2014.09.205
Siontis GC, Ioannidis JP. Risk factors and interventions with statistically significant tiny effects. Int J Epidemiol. 2011;40(5):1292-307. https://doi.org/10.1093/ije/dyr099