Cite as: Oxman AD, Chalmers I, Dahlgren A (2022). Key Concepts for Informed Health Choices: 2.3 Descriptions of effects should clearly reflect the size of the effects. James Lind Library (www.jameslindlibrary.org).
© Andy Oxman, Centre for Epidemic Interventions Research, Norwegian Institute of Public Health, Norway. Email: oxman@online.no
This is the third of four essays in this series explaining key concepts about the trustworthiness of evidence from treatment comparisons. In this essay, we explain four considerations about how treatment effects are described. Be cautious of:
- verbal descriptions alone of the size of effects,
- relative effects of treatments alone,
- average differences between treatments, and
- lack of evidence being interpreted as evidence of “no difference”.
The basis for these concepts is described elsewhere [Oxman 2022].
Be cautious of verbal descriptions alone of the size of effects.
A treatment effect (a difference in outcomes in a comparison) is a numerical concept, but it may be difficult to understand quantitative information about the effects of treatments. Qualitative (descriptive) labels may be easier to understand and can be helpful. However, qualitative descriptions of effects may mean different things to different people, for example, saying that a treatment will ‘slightly reduce’, ‘reduce’, or ‘greatly reduce’ the likelihood of an undesirable outcome; or that a side effect is ‘frequent’ or ‘rare’. In addition, verbal descriptions of treatments can be manipulative, for example, promising ‘amazing results’ or describing treatments as ‘natural’, implying that they are safe because of that.
Patients’ perceptions of verbal descriptions of effects can affect their decisions. For example, a randomized comparison of verbal descriptors suggested by the European Union, such as “common” and “rare” compared to numerical descriptions found, that those verbal descriptions were associated with overestimation of the likelihood of side effects [Knapp 2004]. Patients shown verbal descriptions had more negative perceptions of the medicine than those shown numerical descriptions, and they were more likely to say that the information would affect their decision to take the medicine.
Be cautious of relative effects of treatments alone.
Relative effects are ratios, for example, the ratio of the probability of an outcome in one treatment group compared with that in a comparison group. They are insufficient for judging the importance of the difference (between the frequencies of the outcome). A relative effect may give the impression that a difference is more important than it actually is when the likelihood of the outcome is small to begin with. For example, if a treatment reduces the probability of getting an illness by 50% but also has harms, and the risk of getting the illness is 2 in 100, receiving the treatment may be worthwhile. If, however, the risk of getting the illness is 2 in 10,000, then receiving the treatment may not be worthwhile even though the relative effect is the same.
Absolute effects are differences, for example, the difference between the probability of an outcome in one treatment group compared with that in a comparison group. The absolute effect of a treatment is likely to vary for people with different baseline risks. Facemasks, for example, may have dramatically different effects depending on the baseline risk of infection [Schünemann 2020]. Facemasks reduce transmission of viruses, including coronavirus, but it is uncertain how effective they are for preventing Covid-19 infections [Chu 2020, Glasziou 2021, Talic 2021, Vestrheim 2020]. If we assume a 40% relative reduction in the number of new Covid-19 infections, it is possible to estimate the absolute effect for different baseline risks (Table 1). If the baseline risk is zero, it does not make a difference whether facemasks are used. The number of new infections is zero either way. If there is a low baseline risk, for example in the community when the incidence of Covid-19 is low (and not increasing), the difference is small (about eight fewer new infections if 10,000 people used facemasks for about two months). On the other hand, if the baseline risk is high, say for healthcare workers exposed to patients with Covid-19, the difference is much larger (about 700 fewer new infections per 10,000 people). In fact, the relative effect may also be larger for healthcare workers, if they use medical facemasks (rather than cloth masks), have training, and more often use facemasks correctly compared to people in the community. The absolute effect would also then be larger.
Table 1. Estimates of absolute effects (differences) for different baseline risks of Covid-19 assuming a 40% relative risk reduction
| Baseline riska | Risk with facemasksb | Differencec | |
| No new infections | 0 | 0 | 0 |
| Low risk | 0.2% | 0.12% | 0.08% (8 fewer per 10,000) |
| High risk | 17.4% | 10% | 7% (700 fewer per 10,000) |
- The low baseline risk corresponds to the number of new infections in eight weeks without facemasks if the two-week incidence is 50 per 100,000. The high risk is the assumed baseline risk from a systematic review [Chu 2020].
- The risk with facemasks is based on reducing the baseline risk by 40% (the assumed relative risk reduction).
- The difference between the baseline risk (without facemasks) and the risk with facemasks, showing how many fewer new infections there would be with using facemasks compared to not using facemasks.
Be cautious of average differences between treatments.
Average effects do not apply to everyone. For outcomes that are assessed using scales (for example, to measure weight, or pain) the difference between the average among people in one treatment group and the average among those in a comparison group may not make it clear how many people experienced a big enough change (for example, in weight or pain) for them to notice it, or that they would regard as important. In addition, many scales are difficult to interpret and are reported in ways that make them meaningless. This includes not reporting the lower and upper ‘anchor’, for example, whether a scale goes from 1 to 10 or 1 to 100; whether higher numbers are good or bad; and whether someone experiencing an improvement of, say, 5 on the scale would barely notice the difference, would consider it a meaningful improvement, or would consider it a large improvement.
For example, the average difference in pain relief is not only hard to interpret, but misleading. When asked what they would consider treatment success, patients with chronic pain specify a large reduction in pain intensity, by 50% or more [Moore 2013]. Most people tend to respond to painkillers (or a placebo) in two ways. Some people experience very effective pain relief (50% or more), whereas others experience very little (less than 15%). So, the average pain relief does not reflect what most people experienced in randomized trials of painkillers (analgesics) compared to placebos [Moore 2013]. In Figure 1, the average difference in pain relief is about 28%. A less misleading and easier to understand way of reporting those results would be the difference between the proportion of participants in the analgesic group and the placebo group who were treated successfully (with >50% pain relief). In Figure 1, about 60% more participants were treated successfully with the analgesic compared to placebo.
Figure 1. Proportions of patients with different degrees of pain relief [Moore 2013]
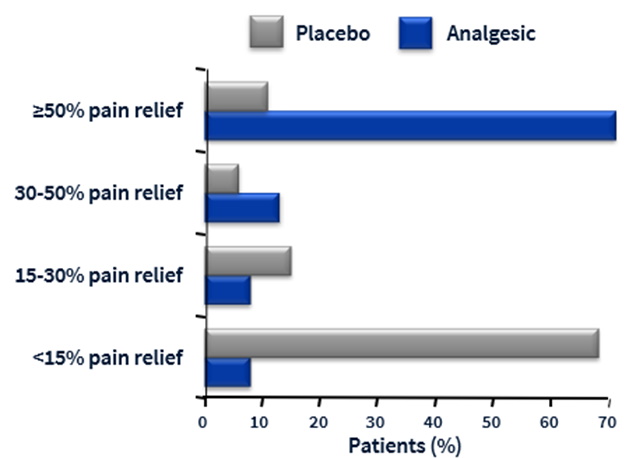
* From Cochrane Pain, Palliative and Supportive Care. Acute postoperative pain: resources. Looking at outcomes, Slideset 3.
Be cautious of lack of evidence being interpreted as evidence of “no difference”.
Systematic reviews sometimes conclude that there is “no difference” between the treatments compared. However, studies can never show that there is “no difference” (“no effect”). They can only rule out, with specific degrees of confidence, differences of a specific size.
Misinterpreting “statistically non-significant” results and failing to recognise uncertainty in estimates of effect can sometimes impede further research to reduce the uncertainty and result in delays in the uptake of effective treatments. For example, a systematic review of randomized trials of thrombolytic therapy (medicine that prevents blood clots from growing) given to patients after an acute heart attack found a 22% relative reduction in mortality that was highly unlikely to have occurred by chance alone [Yusuf 1985]. But only five of the 24 trials had shown a “statistically significant” effect (P<0.05). The lack of “statistical significance” of most of the individual trials and misinterpretation of those results led to a long delay before the value of thrombolytic therapy was appreciated.
Implications
- A verbal description of a treatment effect can be helpful, but it should be considered together with quantitative information about the size of the effect. Be wary of manipulative use of language in descriptions of treatment effects.
- Always consider the absolute effects of treatments – that is, the difference in outcomes between the treatment groups being compared. Do not make a treatment decision based on relative effects alone.
- When outcomes are assessed using scales, it cannot be assumed that every individual in the treatment comparison groups experienced the average effect. Be wary of differences on scales that are not explained or easily understood.
- Don’t be misled by statements of “no difference” between treatments (“no effect”). Consider instead the degree to which it is possible to confidently rule out a difference of a specified size.
This James Lind Library Essay has been republished in the Journal of the Royal Society of Medicine 2023;116:113-115. Print PDF
< Previous Essay | Next Essay >
References
Chu DK, Akl EA, Duda S, Solo K, Yaacoub S, Schünemann HJ. Physical distancing, face masks, and eye protection to prevent person-to-person transmission of SARS-CoV-2 and COVID-19: a systematic review and meta-analysis. Lancet. 2020;395(10242):1973-87. https://doi.org/10.1016/S0140-6736(20)31142-9
Glasziou PP, Michie S, Fretheim A. Public health measures for covid-19. BMJ. 2021;375:n2729. https://doi.org/10.1136/bmj.n2729
Knapp P, Raynor DK, Berry DC. Comparison of two methods of presenting risk information to patients about the side effects of medicines. Qual Saf Health Care. 2004;13(3):176-80. https://doi.org/10.1136/qhc.13.3.176
Moore RA, Straube S, Aldington D. Pain measures and cut-offs – ‘no worse than mild pain’ as a simple, universal outcome. Anaesthesia. 2013;68(4):400-12. https://doi.org/10.1111/anae.12148
Oxman AD, Chalmers I, Dahlgren A, Informed Health Choices Group. Key Concepts for Informed Health Choices: a framework for enabling people to think critically about health claims (Version 2022). IHC Working Paper. 2022. http://doi.org/10.5281/zenodo.6611932
Schünemann HJ, Akl EA, Chou R, Chu DK, Loeb M, Lotfi T, et al. Use of facemasks during the COVID-19 pandemic. Lancet Respir Med. 2020;8(10):954-5. https://doi.org/10.1016/s2213-2600(20)30352-0
Talic S, Shah S, Wild H, Gasevic D, Maharaj A, Ademi Z, et al. Effectiveness of public health measures in reducing the incidence of covid-19, SARS-CoV-2 transmission, and covid-19 mortality: systematic review and meta-analysis. BMJ. 2021;375:e068302. https://doi.org/10.1136/bmj-2021-068302
Vestrheim DF, Iversen BG, Flottorp SA, Denison EM-L, Oxman AD. Should individuals in the community without respiratory symptoms wear facemasks to reduce the spread of Covid-19?–Update 1. Oslo, Norway: Norwegian Institute of Public Health; 2020. https://hdl.handle.net/11250/2722757
Yusuf S, Collins R, Peto R, Furberg C, Stampfer MJ, Goldhaber SZ, et al. Intravenous and intracoronary fibrinolytic therapy in acute myocardial infarction: overview of results on mortality, reinfarction and side-effects from 33 randomized controlled trials. Eur Heart J. 1985;6(7):556-85. https://doi.org/10.1093/oxfordjournals.eurheartj.a061905